Sofema Aviation Services (SAS) www.sassofia.com considers the Advantages Disadvantages and Optimized Purpose of an Effective Soft Tool for Root Cause Analysis
What are we trying to do?
To explore the options in a controlled and structured way and to be able to show both the rationale behind the specific choice as well as the possibilities which have been rejected (effectively we have an audit trail for the decision-making process).
There are many different documentation tools for Root Cause Analysis and examples of the most common are:
a) 5 – Why’s
b) Fishbone diagram
c) Cause-and-effect diagram
What is 5 Why?
A technique which involves repetition of the question why? Each question forms the basis of the next question. The “5” in the name derives from an empirical observation on the number of iterations typically required to resolve the problem.
Why 5 Why’s?
Simply it is an arbitrary value selected to take the user some way on the journey to the “Ultimate Root” of the problem.
The disadvantage of 5 Why’s
A downside of 5 Why is that it does not address the branches of multiple root causes in the most effective way. It is therefore not the best tool for performing RCA however it is ideal for brainstorming and for supporting an understanding of the elements within a chosen branch.
Using Fishbone Techniques
What is the Fishbone Technique?
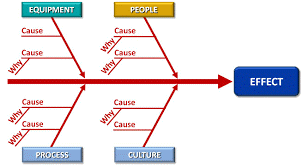
A fishbone diagram also called a cause and effect diagram or Ishikawa diagram, is a visualization tool for categorizing the potential causes of a problem in order to identify its root causes.
Why not use the Fishbone for our Root Cause Analysis?
The fishbone diagram typically has four or Six different groupings. There are many variations, however, the purpose of the diagram is to list anything that may have an influence in respect of each topic.
The fishbone is a tool for brainstorming ideas in different areas, It is not best suited to prove a cause-and-effect relationship. Therefore the use of a fishbone is more appropriate for brainstorming rather than analysis.
Cause-and-Effect Diagram
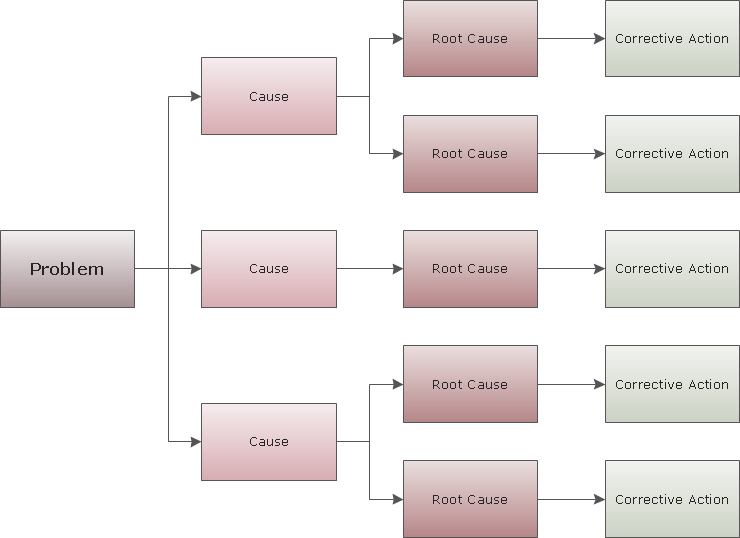 The main advantage of using the cause-and-effect diagram for RCA is that it allows us to focus on one element or “branch” of the diagram at a time.
The Cause-and-effect diagram (pictured as above or in a tree structure) is an excellent way of showing pictorially the cause-and-effect relationship in a viable way which is able to address all elements of the issue in a situation which has multiple root cause possibilities.
Sofema Aviation Services (SAS) is pleased to offer a range of EASA-compliant regulatory training courses in support of the Aviation Quality Management System (QMS) and Safety Management System (SMS) for details please see www.sassofia.com or email: [email protected]