The use of Flowcharts within or supplemental to a procedure provides significant benefits particularly in the development of process documentation. Benefits include the ability to demonstrate regulatory compliance as well as supporting the Quality Control / Quality Assurance Process.
A well-crafted flowchart is visually stimulating and easy to understand. In addition it will gain and maintain the reader’s attention in a way that pure text alone is not able to do.
Flow charts also support analysis of process and the opportunity to identify areas for process improvements.
In order to ensure a consistent use of flowcharts we need to establish and follow a simple set of rules. The following 10 rules will provide guidance on effective use of developing Flowcharts:
Rule 1 – All the specific elements or requirements should be listed in a logical order typically related to either a sequence or timeline.
Rule 2 – The Flowchart should be easy to follow presented in a clear and consistent way, there must be no room for either misunderstanding or ambiguity as this would defeat the whole purpose.
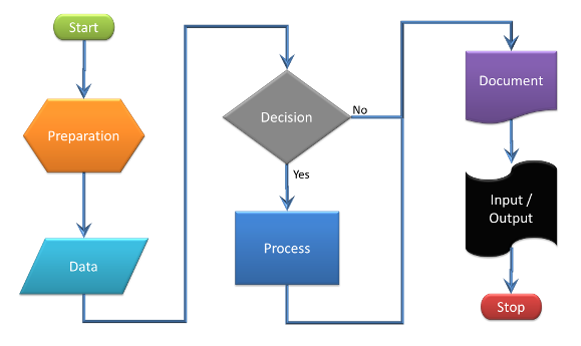
Rule 3 – The direction of use of a flow chart is from left to right and top to bottom (or a combination of both with the intention of the start point being top left and the finish point being bottom right).
Rule 4 – PROCESS SYMBOL – There should be only a single flow line coming out of a process symbol.
Rule 5 – DECISION SYMBOL – There should be one flow line entering a decision symbol however it is possible for (typically) two or three flow lines, (one for each possible answer), leaving the decision symbol.
Rule 6 – TERMINAL SYMBOL – There should be only one flow line used in conjunction with terminal symbol.
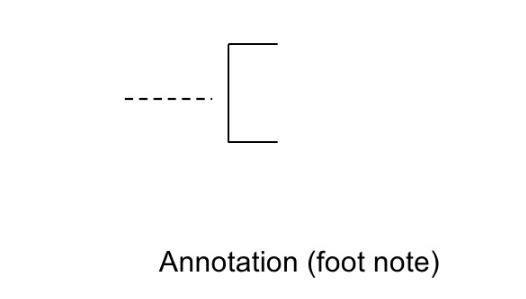
Rule 7- ANNOTATION SYMBOL within the standard symbol text should be kept to a minimum. If it is necessary to expand (for clarification or better understanding) with the additional use of text we should use the annotation symbol.
Rule 8 – CONNECTOR SYMBOLS – If the flow chart starts to become complex, it is better we can use connector symbols to reduce the number of flow lines in a particular area of the flow chart and to maintain the clean presentation.
Rule 9 – To maintain an effective presentation try to avoid the intersection of flowlines, unless it there is no other option & ensure that the flow chart has a logical start and finish.
Rule 10 – Test the validity of the flow chart by applying different data scenarios to check for an acceptable outcome.
Next Steps
Follow this link to our Library to find & Download related documents for Free.
Sofema Aviation Services & Sofema Online provide classroom, webinar & online training. For additional information please email [email protected]